
- May 22, 2025
The Big Picture : A Birds-Eye View
Ever sat through an architecture talk and thought, “Wait, can someone just explain what the hell is going on?” That’s what a context diagram solves.
It shows the big picture: who interacts with the system and what external services it depends on.
Straight from the C4 model by Simon Brown, it’s the System Context Diagram—your software’s cover story. One box in the middle, roles on top, dependencies below. No internal details.
What Is a Context Diagram?
A context diagram is the high level view of your system:
System in the center, treated as a black box.
People on top with arrows pointing in.
External systems at the bottom with labeled arrows.
That’s it. Just inputs, outputs, and delivery channels like “Web Portal,” “Mobile App,” or “Admin Dashboard.”
Real Example: Digital Banking System
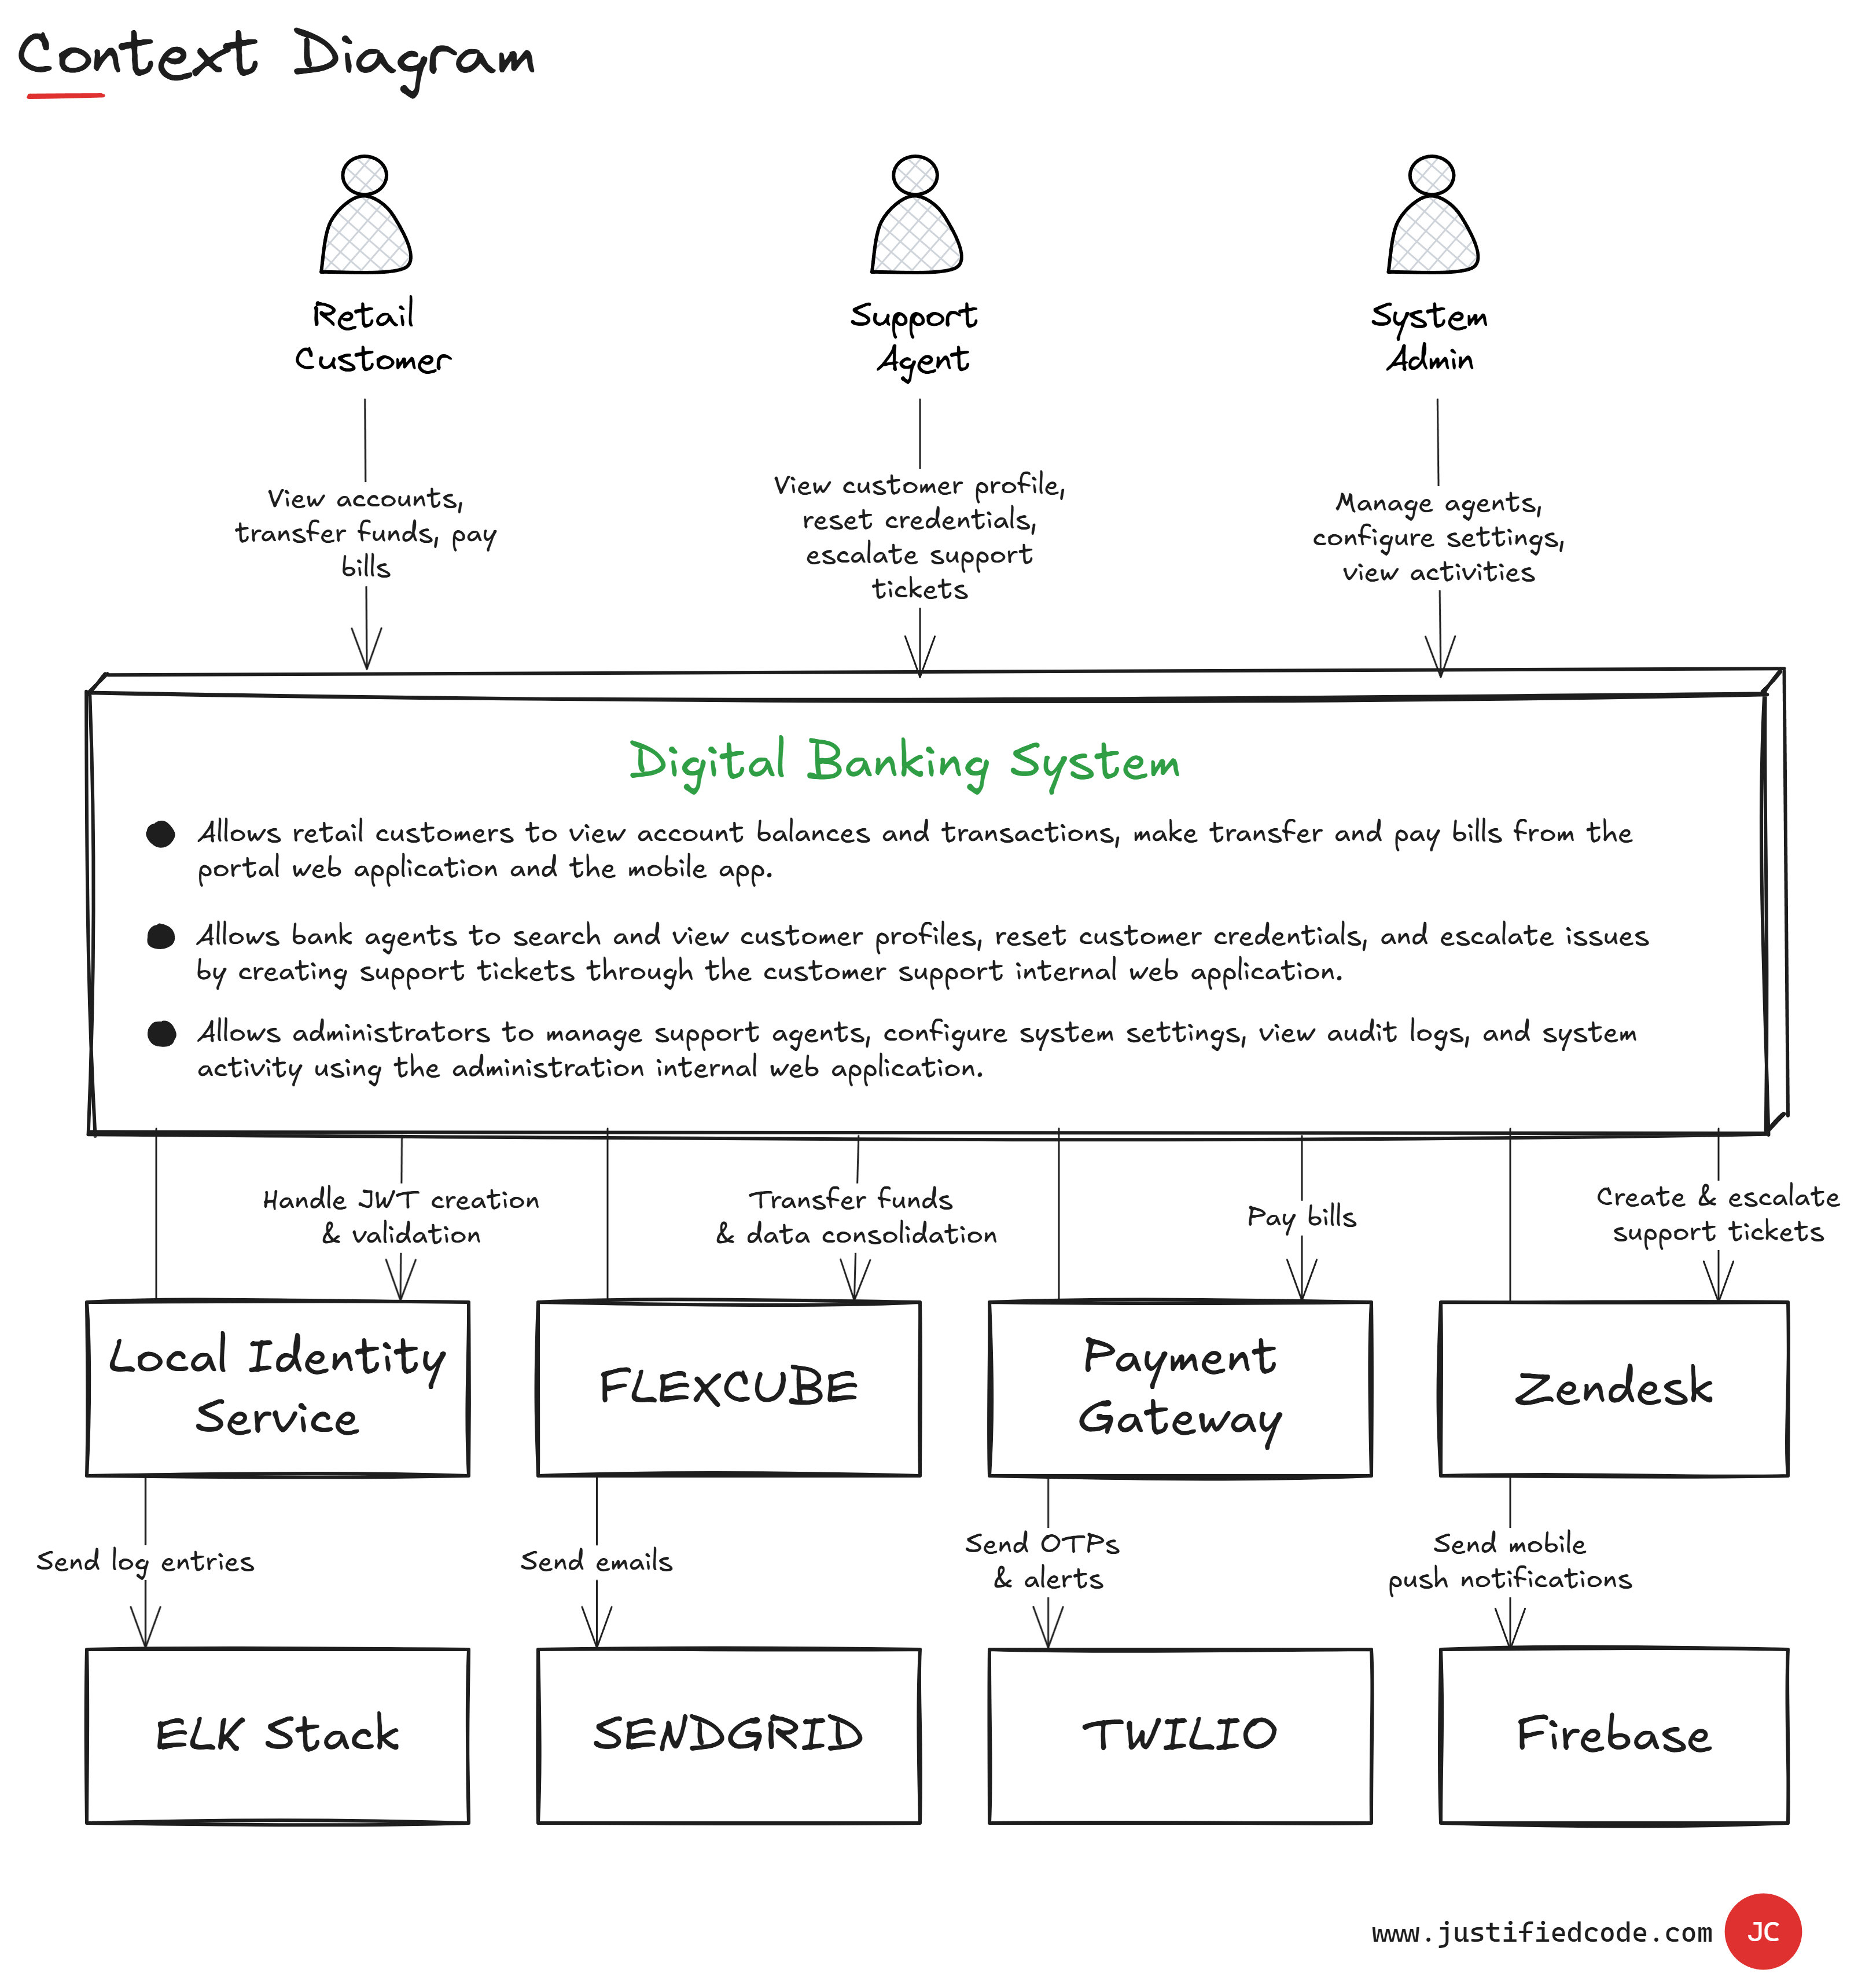
Here’s what a real-world context diagram looks like for a Digital Bank (see figure above).
Retail Customer (Web/Mobile) – Views accounts, transfers funds, pays bills.
Support Agent (Internal Portal) – Views customer profiles, resets credentials, escalates support tickets.
System Admin (Admin Dashboard) – Manages support agents, configures settings, views audit logs/activities.
Each arrow from the role points into the “Digital Banking System” box with labels like “view accounts, transfer funds, pay bills” for the customer.
Below the system box, the diagram shows external dependencies and what they do:
Local Identity Service (Auth) – Handles JWT creation/validation for logins (the arrow says “Handle JWT”).
FLEXCUBE (Core Banking) – Processes transfers and consolidates account data (“Transfer funds & data consolidation” arrow). It triggers emails via SendGrid (e.g. confirmations) and sends mobile push notifications via Firebase.
Payment Gateway (Bill Payment) – Manages bill payments (“Pay bills” arrow). It triggers OTP/SMS alerts through Twilio. Payment gateway name hidden intentionally.
Zendesk (Support Portal) – Creates and escalates support tickets (“Create & escalate support tickets”).
Now everyone can see, for example, that “Retail Customers use the Mobile App/Web Portal to do transfers, and our system calls FLEXCUBE to actually move the money.”
When to Use It
Context diagrams belong at the very start of any architecture discussion – ideally right after you’ve nailed down the use cases analysis diagram.
Skipping the Context diagram forces your business people to guess the big picture. Guessing is dangerous. Instead, give them this roadmap first. It strips away technical complexity and gives stakeholders a bird’s-eye view.
Drop it before the developers talk about microservices or databases. It grounds the conversation. Once you have it up, you can confidently dive into details without losing people.
The Bottom Line
A Context Diagram is the fastest way to get everyone on the same page: your system is a black box, here are its users, and here are the other systems it leans on.
And you know what? It makes you look like you know what you’re doing.
Related Courses
Bridge the gap between business and tech people. See how a justified architect tailor the architecture diagrams for each target audience. Business, Devops, Leads, and Developers, each have distinct concerns. Communicate Like an Architect: Digital Bank Architecture Diagrams